A fuzzy geospatial framework for price shocks propagation: the case of gasoline in Italy
Conference
64th ISI World Statistics Congress - Ottawa, Canada
Format: CPS Abstract
Keywords: bootstrap, clustered-data, cpi, fuzzy, regional, regional economic, spaciotemporal, spatial, spatio-temporal, spatiotemporal
Session: CPS 15 - Finance and business statistics IV
Monday 17 July 4 p.m. - 5:25 p.m. (Canada/Eastern)
Abstract
Inflation is not equal for all. There is an increasing body of evidence measuring dispersion of price levels and inflation rates across space, income levels, and a variety of other dimensions. While there is a growing literature about spatial prices autocorrelation, as well as an increasing number of National Statistical Institutes publishing disaggregated price statistics for sub-national areas and different socio-economic population groups, there is still limited research combining all those dimensions together.
In this paper I study the evolution across time and space of automotive fuel prices in Italy during the 2022 energy crisis. We experienced a sharp rise in fuel prices, and an even sharper decrease in excise duties - which amount to a substantial share of consumer prices - applied to them. This paper is aimed to uncover patterns of propagation for those two shocks, highlighting how geospatial characteristics led to differentiated effects for automotive fuel prices at the gas station. I build on several previous studies that proved how Italy is characterized for its high heterogeneity in subnational consumer price levels.
I leverage several high-frequency data sources for this analysis. First of all, I recovered daily information on automotive fuel prices for each gas station in Italy and its composition - excise duties, VAT, and industrial cost - from the Italian Ministry of Economic development. A gridded population dataset for Italy, adjusted to match the corresponding UNPD 2020 estimates, was recovered from Worldpop. Additional geographic information on administrative boundaries was recovered from the Italian National Statistical institute.
I calculated net industrial prices for automotive fuel in each gas station, removing excise duties and VAT. I then clustered gas stations according to their geographical and commercial characteristics, using both crisp and fuzzy metrics, in order to identify homogeneous groups that shared similar patterns for shock propagation on prices. Those characteristics are intended as a proxy of the distribution costs, potential sales volume, and market power for each individual gas station. As a comparison baseline for explaining automotive fuel price variability across space I use a traditional spatial econometric approach based on kriging and I compare the performance of the two models using bootstrapping and out-of-bootstrap Root Mean Square Error.
Preliminary results show that automotive fuel prices followed a differentiated shock propagation pattern according to specific geospatial characteristics, and the model I propose presents a significant performance improvement over kriging. Future evolution of this work includes the use of an additional dataset with GPS data of traffic flows in order to better capture both potential sales volume and market power of each individual gas station, as well as oil refinery locations and production in order to better capture actual distribution costs linked to logistics.
Figures/Tables
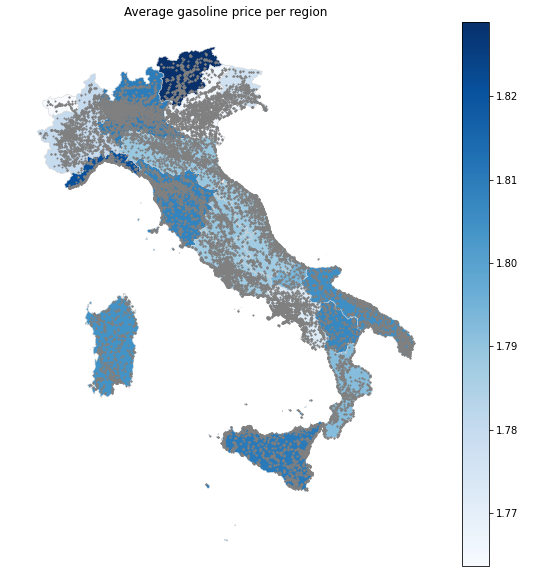
average_Gasoline_price_202109


