Big-data Feature Analysis in a Cyclostationary Model Framework
Conference
64th ISI World Statistics Congress - Ottawa, Canada
Format: CPS Paper
Keywords: big data, time-series
Session: CPS 75 - Statistical modelling IV
Wednesday 19 July 8:30 a.m. - 9:40 a.m. (Canada/Eastern)
Abstract
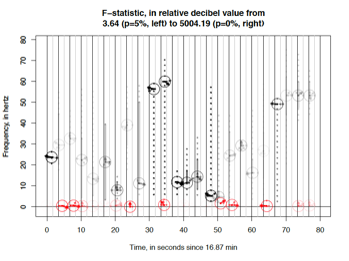
When a harmonic signal appears in noise and the residual noise is red, this may be evidence for residual periodicity, and a simple model for this is to assume the presence of normal modes in the power spectrum. As long as spectral power does not diverge too rapidly approaching zero frequency, it may also be true that the finite-dimensional distribution (FDD) exhibits normality. Here, two visual diagnostics are introduced that make use only of the power spectrum to characterize the FDD. The first diagnostic specifies the quality of harmonic periodicity in both the mean and spectral-power signals, while the second reveals the extent to which the joint FDD of the multitaper Fourier-transform processes exhibits spherical, proper, Gaussian behaviour. It is shown for a two-sample survey of epileptic-seizure, microelectrode-voltage time series how these visualization techniques explain time-evolutionary periodicity for long records in a manner more efficient than a typical spectrogram.
Figures/Tables
Picture1_PNG
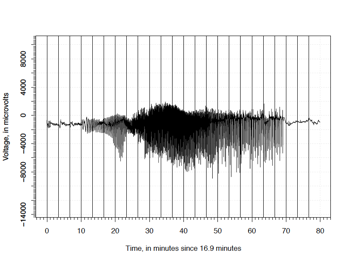
Picture2_PNG
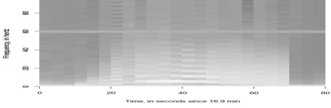
Picture3_PNG